 |
||||||||||||
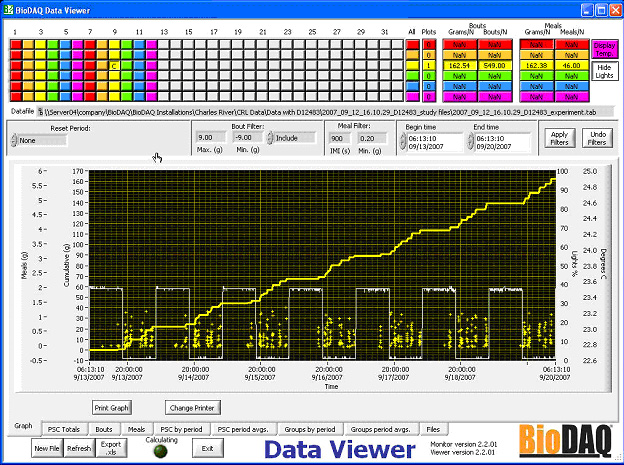
| BioDAQ E2- Data Viewer Sample Data | ||||||||||||
One Week Intake Data This graph shows this animals’ cumulative intake over the course of one week starting at the beginning of the light cycle (6:13:10 AM). The crosses represent the 549 individual episodic bouts collected over the week, totaling 162.54 grams consumed. Using the above defined Meal parameters, there are 46 meals during this 7 day period. |
||||||||||||
Excel based table summarizes this data (abbreviated due to format constraints): |
||||||||||||
 |
 |
 |
||||||||||
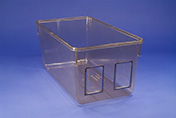
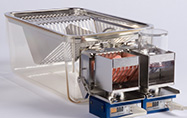
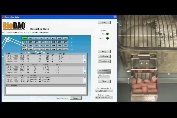
| Enhance your system by adding double cut cages for change out | Optimize your system by adding a double cut cage and water intake module | Watch video of a rat eating in a BioDAQ | ||||||||||
|
|
OpenSource Diets | |||||||||||
|
||||||||||||
| 20 Jules Lane New Brunswick, NJ 08901 Ph. 732.247.2390 Fax 732.247.2340 biodaq@ResearchDiets.com | ||||||||||||